|
Remarks before the Asia Society Hong Kong Center
Hong Kong April 4, 2014 Adieu Quantitative Easing To encourage economic recovery from the debacle of the financial crisis of 2007–09, the FOMC cut interest rates to near zero. The Fed introduced an array of special lending facilities during the most panicked stage of the crisis. These credit and liquidity programs were largely self-liquidating as market functioning improved. But still being “zero bound,” we embarked upon a program of massively expanding the Fed’s balance sheet, referred to internally as “large-scale asset purchases” and popularly known as quantitative easing (QE). By buying copious quantities of longer-term U.S. Treasury bonds and mortgage-backed securities (MBS), our balance sheet has grown from slightly under $900 billion prior to the crisis to $4.3 trillion at present. When the Fed buys a Treasury note or bond or an MBS, we pay for it, putting money out into the economy with the expectation that the money will be used by banks and other creditors and investors to finance job-creating investment, the purchase of homes and other expansive economic activity. Thus far, much of the money we have pushed out into the economy has been stored away rather than expended to the desired degree. For example, we have seen a huge buildup in the reserves of the depository institutions of the United States. Less than a fifth of commercial credit in the highly developed U.S. capital markets is extended through depository institutions. Yet depository institutions alone have accumulated a total of $2.57 trillion in excess reserves—money that is sitting on the sidelines rather than being loaned out into the economy. That’s up from a norm of around $2 billion before the crisis. The Fed’s large-scale asset purchases dramatically and more broadly impacted credit markets. The U.S. credit markets are awash in liquidity. As of March 14, our par holdings of fixed-rate MBS exceeded 30 percent of the outstanding stock of those securities. Through these purchases, we have driven down mortgage rates and helped rekindle the U.S. housing market. We now own just shy of 24 percent of the stock of Treasury coupon securities. Having concentrated our purchases of Treasuries further out on the yield curve, and done so in size, we have driven nominal interest rates across the credit spectrum to lows not seen in over a half century. This has allowed U.S. businesses to restructure their balance sheets, manage their earnings per share through share buybacks financed with bargain-basement debt issuance, bolster stock prices through enhanced dividend payouts and position themselves for financing growth once they see the whites of the eyes of greater certainty about their economic future. By driving nominal interest rates to half-century lows, we have also reduced the hurdle rate by which future cash flows of publicly traded businesses are discounted. Thus, through financial engineering, we have helped bolster a roaring bull market for equities: The indexes for stocks have nearly tripled from the lows reached in March 2009. Alongside these signs of rebound have been some developments that give rise to caution. I have spoken of these in recent speeches, echoing concerns I have raised in FOMC discussions: The price-to-earnings (PE) ratio of stocks is among the highest decile of reported values since 1881. Bob Shiller’s inflation-adjusted PE ratio reached 26 this week as the Standard & Poor’s 500 hit yet another record high. For context, the measure hit 30 before Black Tuesday in 1929 and reached an all-time high of 44 before the dot-com implosion at the end of 1999.[1] Since bottoming out five years ago, the market capitalization of the U.S. stock market as a percentage of the country’s economic output has more than doubled to 145 percent—the highest reading since the record was set in March 2000. Margin debt has been setting historic highs for several months running and, according to data released by the New York Stock Exchange on Monday, now stands at $466 billion.[2] Junk-bond yields have declined below 5.5 percent, nearing record lows.[3] Covenant-lite lending is becoming more widespread. In my Federal Reserve District, 96 percent of which is the booming economy of Texas, bankers are reporting that money center banks are lending on terms that are increasingly imprudent. The former funds manager in me sees these as yellow lights. The central banker in me is reminded of the mandate to safeguard financial stability. As I said recently in a speech in Mexico, we must watch these developments carefully lest we become responsible for raising the ghost of irrational exuberance. It is clear to me that we have a liquidity pool that is more than sufficiently deep and wide enough nationwide to finance job-creating capital expansion and reduce labor market “slack.” But that will happen only if and when our fiscal authorities—the Congress and the president—are able to muster the courage to craft tax, spending and regulatory incentives for job-creating enterprises to mobilize liquidity for expansion and payroll growth. Thus far, inflation has yet to raise its ugly head, and inflation expectations as measured by consumer surveys and market-traded instruments have remained stolid. However, with each passing day, constantly adding massive amounts to the monetary base will inevitably present a significant challenge to the FOMC, which must ultimately manage this high-power money so that it does not become fuel for sustained inflation above the committee’s 2 percent target once it is activated and flows into the economy. Thus, I was more than supportive of the collective decision of the FOMC to begin cutting back on our rate of accumulation of assets beginning in December. Over the course of our recent meetings, we have cut back from accumulating $85 billion per month in Treasuries and MBS to a present rate of $55 billion per month. This is still somewhat promiscuous. Even with the taper, the recent decline of mortgage supply has driven our absorption of the MBS market to 85 percent of fixed-rate MBS issuance. The fall in net MBS supply is outpacing the taper. At the current reduction in the run rate of accumulation, the exercise known as QE3 will terminate in October (when I project we will hold more than 40 percent of the MBS market and almost a fourth of outstanding Treasuries). We will then be back to managing monetary policy through the more traditional tool of the overnight lending rate that anchors the yield curve. Full Text Weekly Market Comment April 7, 2014 by John P. Hussman, Ph.D. Excerpts: The financial markets are at a transition that reflects tension between two realities. The first is that the Federal Reserve’s policy of quantitative easing has driven the stock market to valuations associated with the most extreme speculative peaks on record, coupled with a fresh boom in initial public offerings – with companies having zero or negative earnings accounting for three-quarters of new issuance – and record issuance of “covenant lite” leveraged loans (loans to already highly indebted borrowers, lacking normal protections that mitigate losses in the event of default). The other reality is that unconventional monetary policy has done little to push real economic activity or employment past the border that has historically distinguished expansions from recessions (about 1.8% year-over-year growth in both real final sales and non-farm payroll employment). There is no question that quantitative easing has supported the mortgage market, and was almost wholly responsible for that role in late-2008 and 2009. But QE is not what ended the financial crisis (the March 2009 change in accounting rule FAS 157 is what removed the risk of widespread bank failures). Any economist familiar with the work of Nobel laureates like Milton Friedman or Franco Modigliani, or simply with decades of economic data, could have predicted even in 2010 that Bernanke’s efforts at creating a “wealth effect” would have weak effects on consumption, job creation and economic activity. In order to get any meaningful overall effect, it was clear that the Fed would have to create enormous but ultimately temporary distortions, inviting risk of longer-term financial instability. The Fed has now done exactly that. --- The tortured narrative of these efforts should be obvious. As Fred Hickey of the High Tech Strategist observed last week, “After the tech bubble broke, the Fed jumped in to save the markets and economy with a period of extraordinarily low interest rates, which then led to the gross malinvestment in the housing sector (another bubble) and the misallocation of capital in the credit markets. The housing bubble imploded first, and the credit markets followed, leading to one of the worst financial crises in US history in 2008. Once again, the Fed stepped in to save the markets and the economy, this time with really free money (0% short-term interest rates for almost six years and counting) as well as trillions of dollars in outright money printing. Every time the Fed steps in… money gets misallocated and trouble follows.” Some of the misallocations noted by Hickey include the Fed-enabled runup in the national debt to $17.57 trillion, the surge in global debt issuance to $100 trillion, up from $70 trillion at the mid-2007 peak, the suspension of any need to address unfunded entitlement liabilities, a doubling of the student loan burden, record highs in subprime auto lending, soaring corporate borrowing – partly to buy back stock at inflated valuations (notes Hickey, “as they always tend to do at market tops”) and partly to prop up sagging per-share earnings, a record $465.7 billion in margin debt, more initial public offerings in Q1 than at any point since the 2000 bubble peak, and a litany of other speculative outcomes. Having witnessed the glorious advancing portion of the uncompleted market cycle since 2009, investors might, perhaps, want to consider how this cycle might end. After long diagonal advances to overvalued speculative peaks, the other side of the mountain is typically not a permanently high plateau. I captured a screenshot on Friday morning, in order to put a timestamp on what may prove – in hindsight – to be a point in history worth remembering. 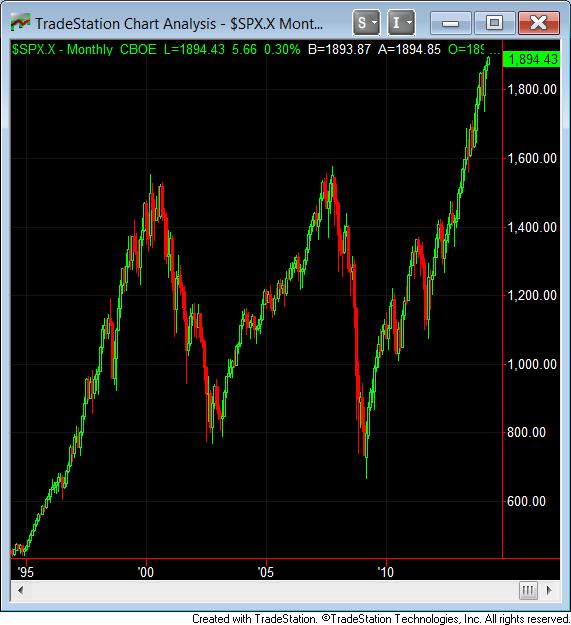
That said, I should also reiterate that market peaks are not a moment but a process. The bars on the chart above are monthly. If you look carefully, it should be clear that the 2000 and 2007 peaks involved an extended period of volatility that included sharp selloffs, thrilling recoveries, marginal new highs, fresh breakdowns, and sideways movement. All of that day-to-day and week-to-week emotion and uncertainty is absent from a long-term chart where investors know, in hindsight, how utterly insignificant all of it was in the context of what followed.
In 2000 and 2007, we regularly encountered two arguments, which boil down to a) there’s no catalyst, and b) this time is different. In 2000, it was a New Economy. In 2007 and 2008, Ben Bernanke assured investors that the risks were “contained” and Janet Yellen confidently dismissed concerns about speculative risk with the words “No, No, and No.” History suggests a straightforward response: following speculative peaks, market losses are typically in full swing well before any catalyst is widely recognized, and b) the specifics of every cycle may be different, but broadly speaking, speculative episodes end the same way. By John Mauldin April 05, 2014 Lions in the US Stock Market? Before the credit crisis, market makers like Bear Stearns, Goldman Sachs, Merrill Lynch, Morgan Stanley, and Bank of America created a huge amount of the overall liquidity in major markets by consistently taking “the other side” of trades. If the markets were selling, market makers bought, and vice versa. In the wake of 2008, the big market makers either went out of business, merged, and/or were forced to operate at much lower levels of leverage. The net effect is far less trading volume from market makers and other forms of “real money,” to the point that high-frequency trading and ETFs accounted for about 66% of all trading volume in 2010. While that number has fallen to about 50% today, equity mutual fund flows suggest that higher trading volume from smaller investors, not the resurrection of market makers, is responsible for the shift. In fact, the following chart from Credit Suisse suggests that the average daily trading volume from “real money” fell by more than half from 2008 to 2012, as high-frequency trading advanced. I do suspect that “real money” volume is rising today with the rotation that is underway into an overvalued, overbought, and overbullish market (but let’s save that for our conclusion). 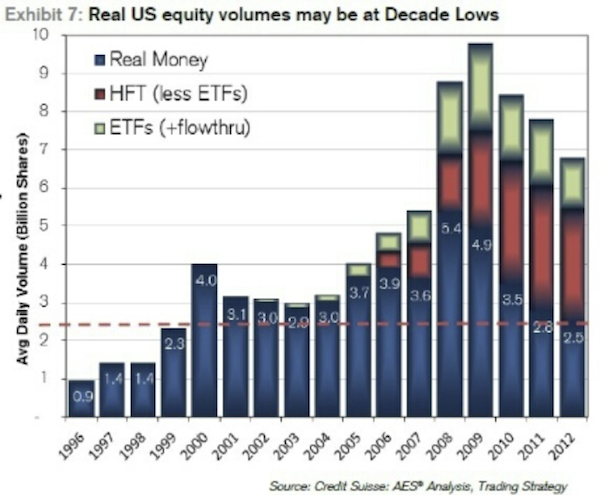
Understanding how the structure of market participants has changed, let's think about the effect of there being less market-making volume to balance against high-frequency trading and the retail/institutional herd. On May 6, 2010, the markets sold off for most of the day, and market makers expanded their volume as the media ran all-day coverage of a small riot in Greece. But (and this is critical), market makers who can no longer buy at 40x leverage will carry only so much inventory overnight. At some point market makers must stop buying ... and they did when a large sell order came into the market toward the end of the day on May 6. The market makers stepped back instead of providing liquidity, precipitating a sharp drop in prices. Then many of the HFTs shut their systems down, seeing an irregular trading pattern and fearing another “Quant Crisis” like the one in October 2007. Liquidity dried up in a matter of minutes, and the market went into free fall … triggering stop losses and emotional selling from the general public. (As they saw the market collapse and the rioting in Greece, people may have thought, “Something big just happened and I am late... sell everything!”). Without market makers to provide volume, an orderly sell-off became a chaotic collapse. Now, with market-maker volume way down, a similar situation could develop again; and once again the general public will rush to sell if liquidity evaporates. We should really think about this dynamic, because the next correction may look more like the stock market crashes of 1929 or 1987 as opposed to the more gradual "cascading crash" we all experienced in 2008. With that in mind, investors will do well to pay attention to the ever-changing structural makeup of the markets before blindly jumping in. Just because US stock markets – along with a lot of the major markets around the world – have found new highs since 2008 doesn’t mean they have healed structurally. It doesn’t mean they are stable. And with long-term valuations at historic levels, both on an absolute basis and relative to the rest of the world, US equity markets are both unstable AND overpriced. The inevitable correction that is coming to US markets could be a catalyst for a downturn in the broader economy, and without much of a warning. It could be another lion, prowling through fiber-optic cables, data feeds, and stock exchange servers. I continue to believe that high-frequency trading should be reined in. It is creating the illusion of liquidity, which can dry up in a heartbeat while at the same time sucking billions of dollars from the trading of individuals and institutions. 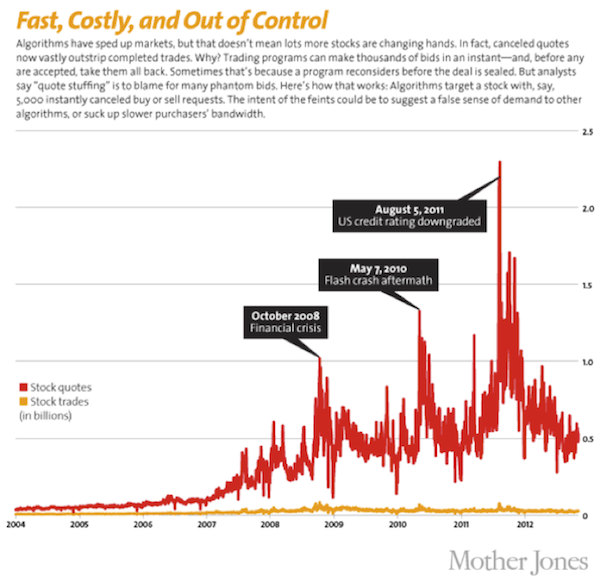
I’m not trying to stop computerized trading, but if the bid or offer were required to last for at least half a second, I think the problem would be mostly fixed.
John P. Hussman, Ph.D.
Weekly Market Comment March 31, 2014 In the face of financial markets that we view as steeply overvalued as a result of yield-seeking by investors, an important development in the financial markets in recent months is the gradual recognition by the Federal Reserve that, in the words of several FOMC members, the policy of quantitative easing has “overstayed its welcome”, and that the Fed has attempted to “overplay its hand.” As FOMC member Richard Fisher has observed, the Fed is “distorting financial markets and creating incentives for managers and market players to take increasing risk.” Member Charles Evans – correctly in our view – openly warns “I am very worried about the potential for unintended consequences of all this action.” Esther George concurred last week “these policy settings also contain risk in the long run to financial stability.” FOMC member James Bullard observed that the Fed has set “a high bar” for moving away from tapering QE. Charles Evans and Naranya Kocherlakota, in contrast, remain dovish as ever. Among the moderates, Sandra Pianalto indicated that the first step to unwinding the Fed’s balance sheet would likely be to stop reinvesting the proceeds of maturing Treasury and mortgage debt held by the Fed. The key observation here is that the Fed is wisely and palpably moving away from the idea that more QE is automatically better for the economy, and has started to correctly question the effectiveness of QE, as well as its potential to worsen economic risks rather than remove them. --- With regard to the debt markets, leveraged loan issuance (loans to already highly indebted borrowers) reached $1.08 trillion in 2013, eclipsing the 2007 peak of $899 billion. The Financial Times reports that two-thirds of new leveraged loans are now covenant lite (lacking the normal protections that protect investors against a total loss in the event of default), compared with 29% at the 2007 peak. European covenant lite loan issuance has also increased above the 2007 bubble peak. This is an important area for regulatory oversight. --- Meanwhile, almost as if to put a time-stamp on the euphoria of the equity markets, IPO investors placed a $6 billion value on a video game app last week. Granted, IPO speculation is nowhere near what it was in the dot-com bubble, when one could issue an IPO worth more than the GDP of a small country even without any assets or operating history, as long as you called the company an “incubator.” Still, three-quarters of recent IPOs are companies with zero or negative earnings (the highest ratio since the 2000 bubble peak), and investors have long forgotten that neither positive earnings, rapid recent growth, or a seemingly “reasonable” price/earnings ratio are enough to properly value a long-lived security. As I warned at the 2000 and 2007 peaks, P/E multiples – taken at face value –implicitly assume that current earnings are representative of a very long-term stream of future cash flows. --- The same representativeness problem is evident in the equity market generally, where investors are (as in 2000 and 2007) valuing equities based on record earnings at cyclically extreme profit margins, without considering the likely long-term stream of more representative cash flows. There’s certainly a narrow group of stable blue-chip companies whose P/E ratios can be taken at face value. But that’s because they generate predictable, diversified, long-term revenue growth, and also experience low variation in profit margins across the economic cycle. Warren Buffett pays a great deal of attention to such companies. But looking at major stock indices like the S&P 500, Nasdaq and Russell 2000 as a whole, margin variation destroys the predictive usefulness of P/E ratios that fail to take these variations into account. Similarly, the “equity risk premium” models often cited by Chair Yellen and others perform terribly because they fail to capture broader variation in profit margins over the economic cycle. Even measures such as market capitalization / national income and Tobin’s Q have dramatically stronger correlations with actual subsequent market returns (particularly over 7-10 year horizons), and have been effective for a century, including recent decades. The FOMC would do well to increase its oversight of areas where exposure leveraged loans, equity leverage, and credit default swaps could exert sizeable disruption. From a monetary policy standpoint, the effort to shift from a highly discretionary policy to a more rules-based regime is a welcome development… except for speculators banking on an endless supply of candy. |
A source of news, research and other information that we consider informative to investors within the context of tail hedging.
The RSS Feed allows you to automatically receive entries
Archives
June 2022
All content © 2011 Lionscrest Advisors Ltd. Images and content cannot be used or reproduced without express written permission. All rights reserved.
Please see important disclosures about this website by clicking here. |
 RSS Feed