|
The Convexity Maven "How Will I Know..." by Harley S. Bassman March 19, 2018 Excerpt: 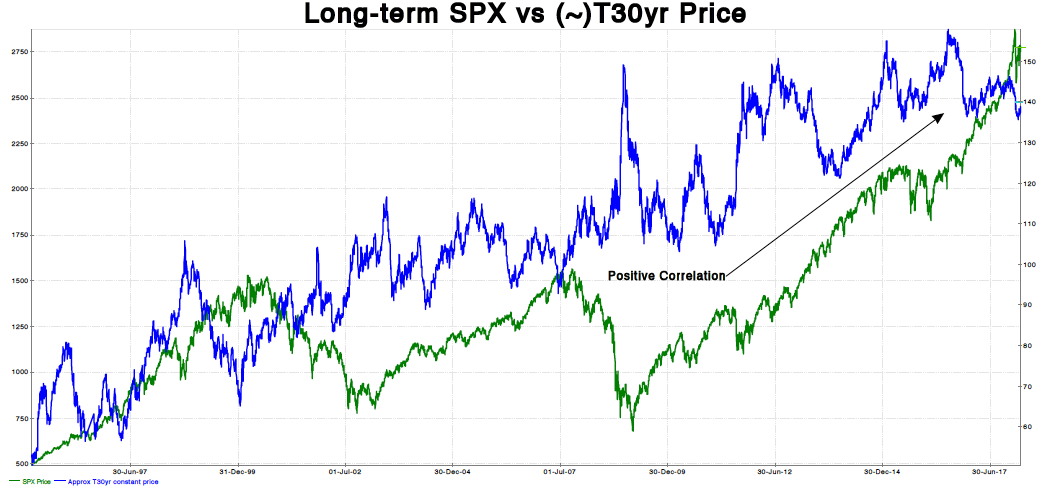 Risk Parity’s tremendous success is revealed via the –pummelo line- of the SPX price in the chart above and the –santol line- of the price of a constant 30-year treasury bond. Risk Parity portfolios have been ‘levered long’ assets that have both increased in value. (We used to call this a Texas-hedge.) Here is the bottom line: If this correlation turns negative so that both stock and bond prices decline, Risk Parity portfolios will be modified to reflect these new correlations and volatilities. In simple terms, they will sell. Risk Parity portfolios will not remain levered long if both assets are declining.
by Mark Spitznagel
Pensions & Investments March 9, 2018 A common refrain among pundits today, in response to the more volatile markets recently and the potential for even more to come, is to point to the historical average annual return of stocks — for example, the S&P 500 total return over the past decade of 10.4%. That's been better than pretty much anything else. While this is true — and even if you were unfazed by the unsettling prospect of likely far less central bank accommodation ahead — this buy-and-hold strategy ignores an important, although perhaps subtle, part of the story. When it comes to investing in hopes of capturing the market's long-run average returns, you can't always get what you want. The average market return is an elusive thing. It doesn't even really exist, in practice. A decade ago, if you had possessed a crystal ball informing you about that nice 10.4% average annual return to come, you would have likely mentally compounded a nest egg of, for instance, $1,000 invested in the S&P 500 into an expectation of roughly $2,690 in capital 10 years later, as of the end of last year. This is just from the simple math of compounding: (1+.104)^10 =2.690 This would have been a good textbook mathematical expectation of your geometric growth in capital. But your expectation would have been quite wrong. Turns out, when compounding market returns over time, the average that you get isn't always what you want. It is highly "non-ergodic"— the "time average" compound rate just isn't computable based on the expectation of that average (the "ensemble" average). Sadly, your perfectly forecast average wouldn't have translated into value at the end, and your expectation was entirely inaccessible. Why? The very thing that seems to be on everyone's minds today: Volatility. Volatility is destructive. It eats away at the rate at which capital compounds in a portfolio over time. We know how this works intuitively: Lose 50% one year, make 100% the next, and you've experienced an impressive average return of 25%, yet you just barely made it back to even. By the same compounding consequences, that $1,000 back in 2008 actually would have become only $2,261 today, an average annual return of about 8.5% — far less than your assumed 10.4%. There was a "volatility tax," as I call it, amounting to about $429 (or about 16%) imposed on your capital. (That's an even higher tax than they pay in New York City!) The S&P 500's volatility wrought havoc on the compounding of that $1,000. In quantitative finance parlance, we can see how this works by considering that the compound (or geometric) average return is mathematically just the average of the logarithms of the arithmetic price changes. Because the logarithm is a concave function (it curves down), it increasingly penalizes negative arithmetic returns the more negative they are, and thus the more negative they are, the more they lower the compound average relative to the arithmetic average — and raise the volatility tax. (While this logarithmic effect is quite independent of the particular return distribution of those arithmetic returns, it so happens that the S&P 500's 19.3% volatility over the past decade imposed the very same volatility tax that we would have calculated assuming the flawed "lognormal" assumption of arithmetic returns, namely .104 - .1932/2 = .085). What can we do about this non-ergodicity problem, which causes us to so miss our expectations? We need to find a way to narrow the gap between our ensemble and time averages. (In the gambling literature there is a useful solution called the "Kelly criterion"— and in fact much of this, and my investing, is but an interpretation of that). The good news is the entire hedge fund industry basically exists to help with this — to help save on volatility taxes paid by portfolios. The bad news is they haven't done that, not at all. Any amount of that $1,000 invested in, say, the HFRI Fund Weighted Composite index in 2008 would have added even more to your cost over the next decade ($100, or 10%, allocated to the HFRI hedge fund index, rebalanced annually, would have cost you $96). Ditto bonds ($400 allocated to the Barclays U.S. Aggregate Bond index, rebalanced annually — as in the traditional 60/40 stocks-bonds allocation — would have cost you $247). Even today's celebrated "long volatility" strategies would have barely added value ($100 allocated to the Cboe Eurekahedge Long Volatility index, rebalanced annually, would have added just $38). Most "risk mitigation" strategies simply haven't deserved the moniker. "Diversification"— modern portfolio theory's answer to this vexing non-ergodicity, volatility tax problem — hasn't really worked, at least not without ironically utilizing leverage. (This begs the question: What was diversification even good for?) So much for modern portfolio theory. The moral of the story: Let's not rely on the market's historical average return to buy-and-hold ourselves to presumed safety. Buy-and-hold is not an effective risk mitigation strategy (and neither is diversification, for that matter). It's more like a hope and a prayer for low volatility. Yes, the market's historical average return has been pretty good up until now (thanks, in large part, to the Federal Reserve keeping interest rates low for an extended period). But, even if that average persists, you can't always get it. In fact, thanks to market volatility, you likely never will. --- Mark Spitznagel is founder and chief investment officer of Universa Investments, Miami. This content represents the views of the author. It was submitted and edited under P&I guidelines, but is not a product of P&I's editorial team. |
A source of news, research and other information that we consider informative to investors within the context of tail hedging.
The RSS Feed allows you to automatically receive entries
Archives
June 2022
All content © 2011 Lionscrest Advisors Ltd. Images and content cannot be used or reproduced without express written permission. All rights reserved.
Please see important disclosures about this website by clicking here. |
||
 RSS Feed